Problem
Definition
a. Background
To The Problem:
Banking
operations are becoming increasingly customer dictated. The demand for 'banking
super malls' offering one-stop integrated financial services is well on the
rise. The ability of banks to offer clients access to several markets for
different classes of financial instruments has become a valuable competitive
edge. With the phenomenal
increase in the country's population and the increased demand for banking
services; speed, service quality and customer satisfaction are going to be key
differentiators for each bank's future success. Thus it is imperative for
banks to get useful feedback on their actual response time and customer service
quality aspects of retail banking, which in turn will help them take positive
steps to maintain a competitive edge.
The
working of the customer's mind is a mystery which is difficult to solve and
understanding the nuances of what customer satisfaction is, a challenging task.
This exercise in the context of the banking industry will give us an insight
into the parameters of customer satisfaction and their measurement. This vital
information will help us to build satisfaction amongst the customers and
customer loyalty in the long run which is an integral part of any business. The customer's requirements must be translated
and quantified into measurable targets. This provides an easy way to monitor
improvements, and deciding upon the attributes that need to be concentrated on
in order to improve customer satisfaction. We can recognize where we need to
make changes to create improvements and determine if these changes, after implemented,
have led to increased customer satisfaction. "If you cannot measure
it, you cannot improve it." - Lord William Thomson Kelvin (1824-1907).
b.
Statement Of The Problem:
This paper identifies the
factors that relate to customer satisfaction in the banking industry, the most
important factors among the proposed factors, determining the importance of
these factors and identifying their level of satisfaction. It also suggests
some ways the banks can follow to improve the level of customer satisfaction regarding
it.
Therefore, the specific
objectives of the paper are:
1. To
identify the factors that relate to customer satisfaction in Banks
2. To
determine the most important factor among the proposed factors
3. To
determine the importance of each proposed factor
4. To
determine the level of satisfaction
c.
Limitations:
The
study has some limitations; which are:
»
Sampling
Technique
The
sampling technique of this study is convenient sampling which is a
non-probability sampling technique. Therefore, the samples considered here may
not be representative of the defined population. As a result, the
generalizability of the findings is quite low.
»
Sampling
Error
As
the sample size is only 56, random sampling error is occurred in this study.
»
Respondent
Error
In
some cases, it is found that respondents are unable to remember the actual
response. This inability has led to errors of omission, telescoping, and
creation.
Literature Review
Customer
satisfaction represents a modern approach for quality in enterprises and
organizations and serves the development of a truly customer-focused management
and culture. Customer satisfaction is a key and valued outcome of good
marketing practice. According to Drucker (1954), the principle purpose of a
business is to create satisfied customers. Increasing customer satisfaction has
been found to lead to higher future profitability (Anderson, Fornell, and
Lehmann 1994), lower costs related to defective goods and services (Anderson,
Fornell, and Rust 1997), increased buyer willingness to pay price premiums,
provide referrals, and use more of the product (Reichheld 1996; Anderson and
Mittal 2000), and higher levels of customer retention and loyalty (Fornell
1992; Anderson and Sullivan 1993; Bolton 1998). In another study Increasing
loyalty, in turn, has been found to lead to increases in future revenue
(Fornell 1992; Anderson, Fornell, and
Lehmann 1994) and reductions in the cost of future transactions (Reichheld
1996; Srivastava, Shervani, and Fahey 1998).
Measuring
customer satisfaction offers an immediate, meaningful and objective feedback
about clients’ preferences and expectations. In this way, company’s performance
may be evaluated in relation to a set of satisfaction dimensions that indicate
the strong and the weak points of a business organization. (Mihelis
et al, 1999). customer loyalty to profitability and profitability. An estimate of the effects
of increased customer satisfaction on profitability suggests that attainable
increases in satisfaction could dramatically improve profitability. (Roger
Hallowell, 1996). This makes it possible to hold customer satisfaction programs
accountable, in the way that other business programs are held accountable, by
forcing them to demonstrate their benefits with respect to bottom-line
profitability loyalty and retention of customers also depend on the overall
customer satisfaction. (Rust
& Zahorik, 2002). The American Customer Satisfaction Index
(ACSI) indicates that loyalty is a great factor that defines the customer
satisfaction (Fornell et. al, 1996). Tantakasem and Lee says that today’s the
strategy of service related industry is to win the customer satisfaction by
providing superior service. This study enhances the relationship between
customer satisfaction and service quality. If the customer is fully satisfied
then he will be loyal with the bank otherwise he will switch off to that bank
which provides the better services. Gremler and W.Brown describes that business
are not concerned only with attracting and satisfying customers but also to
maintain a long-term relationship with the customers. When the customer is
satisfied with the banks services then ultimately he will maintain his business
terms with the bank and ultimately the profit of bank will also increase. Jamal
and Naser(2002) and Beerli et al (2004) found the bank service quality as an
important antecedent of customer satisfaction which leads towards customer
loyalty. Jamal and Naser(2002) looked into the impact of service quality
dimensions and customer expertise on satisfaction. Three dimensions of bank
service quality are core (i.e. related to transaction accuracy and speed),
relational (i.e. related to bank staff behavior) and tangible (i.e. related to
bank layout) dimensions. Findings indicate that both core and relational
dimensions of are more linked to customer satisfaction. Findings also indicate
that customer expertise is negatively related to satisfaction.
Saulaite
et al (2000) conducted a study in Qatar to assess whether customer services provided
by banks are satisfactory to customers. Findings reveal that bank customers in
Qatar are satisfied for convenient location and layout, politeness of staff and
responsiveness to their needs. They are dissatisfied with bank interest rate
policies and fee charged. Kiser (2000) mentions that customer service and
location are the most cited for remaining with a bank. Holstius et al. (1995)
cited efficiency and courtesy of bank staff as the most important attributes in
determining overall customer satisfaction, while other important attributes Ire
convenience of location, range of services, reputation and availability of
innovations. Sureshchander et.al (2003) focuses on investigating the factors of
customer perceived service quality of three banks in India. The banks are
local, private and foreign bank. From study it comes to know that customers are
most satisfied with the foreign bank as compared to other banks. A foreign bank
provides the core services and other service in the standardized and simplified
process.
Nazmul (2005) prepared an article on “Measurement of
Customer Satisfaction of Credit Card Users”. This article has addressed around
the importance of measuring customer satisfaction of credit card. It is far
less costly to keep existing customers than to win new ones. Banks providing
credit cards should always keep on improving so as to achieve a greater
profitability. This can be achieved by knowing the market well and
understanding how products and services provide value for customers. Satisfaction
surveys and analyzes the customer feedback.
Approach To
The Problem
Research
Framework:
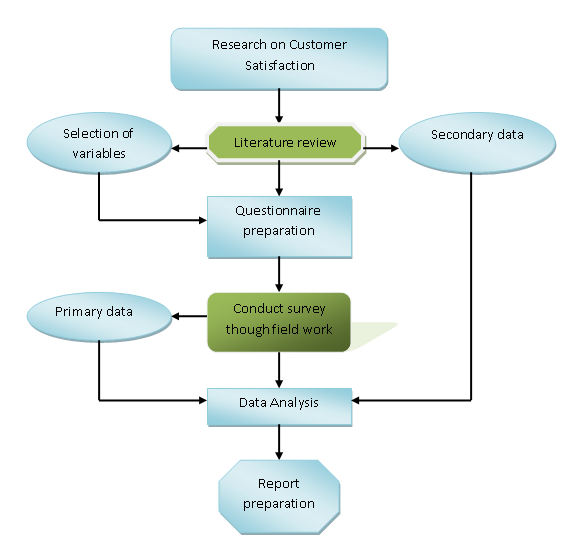
Conceptual
Framework:
In this study, the dependent
variable is “Customer satisfaction “.To find out the dependency of this
variable, 5 independent variables are selected. These independent variables
are: Reliability, Responsiveness, Assurance, Empathy, Tangibles.
Analytical model:
Our
principal analytical tool is linear regression model which is commonly known
as, the Working-Leser functional form. The form looks like this:
 |
Y = Customer
Satisfaction
β 0 =
Constant ( intercept o the variable)
β 1 =
Coefficient of Reliability
X 1 =
Importance of Reliability
β 2 =
Coefficient of Responsiveness
X 2 =
Importance of Responsiveness
β 3 =
Coefficient of Assurance
X 3 =
Importance of Assurance
β 4 = Coefficient of Empathy
X 4 = Importance of Empathy
β 5 =
Coefficient of Tangibles
X 5 =
Importance of Tangibles
e =
Error
Other then this formula, other
descriptive statistical tools is being used in this paper like, frequency
distribution, crosstabs etc.
And
for SURVQUAL analysis, this method will be use:
 |
Hypotheses:
Based
on the research question the following hypothesis has been developed:
Ho:
Reliability has no impact on customer satisfaction
H1:
Reliability has impact on customer
satisfaction
H0:
Responsiveness has no impact on customer satisfaction
H2:
Responsiveness has impact on customer satisfaction
H0:
Assurance has no impact on customer satisfaction
H3:
Assurance has impact on customer satisfaction
H0:
Empathy has no impact on customer satisfaction
H4:
Empathy has impact on customer satisfaction
H0:
Tangibles has no impact on customer satisfaction
H5:
Tangibles has impact on customer satisfaction
Research Design
Research
design is a framework or blueprint for conducting the marketing research
project. It specifies the details of the procedures necessary for obtaining the
information needed to structure and solve marketing research problems.
a.
Type of Research
Design
In
this study, Descriptive research
design has been applied to identify the factors related to customer
satisfaction of banks.
b.
Information
Needed
In
order to measure the customer satisfaction of different banks, bank account
holders have been used.
c.
Data Collection
To
conduct the study, both primary and secondary data were used and collected from
different sources. Primary data were collected from 100 respondents through
survey method.
Primary data sources
were students, service holders, businessmen and homemakers. In contrast, Secondary data sources were literature
reviewed.
d.
Scaling Technique
To
analyze the data collected through survey method, 9 (nine) point Likert scale
was used. Using this scale, the degree of agreement or disagreement with each
of statements regarding the factors determining customer satisfaction was
measured to evaluate the significance of those.
e.
Questionnaire
Development & Pretesting
A
questionnaire with 15 (fifteen) questions was developed for obtaining
quantitative primary data in this research. It had been pretested on 5
respondents before final data collection for more accuracy. Among these 15
(fifteen) questions; 10 (ten) were multiple choice, and 7 (seven) scale.
f.
Sampling
Techniques
The
sample was selected for this study based on the interviewers’ convenience.
Therefore, the sampling technique can be termed as ‘Convenient Sampling’ which
belongs to ‘Non-probability Sampling Technique’ category.
g.
Field Work
Field
work was conducted on 56 (Fifty Six) respondents. The sampling units include:
students, corporate personnel, businessmen and homemakers. The survey was
conducted throughout the Dhaka city.
Data Analysis
a.
Methodology:
The paper is done with both qualitative and quantitative research.
This has taken the form of descriptive and exploratory research. For this paper
we have used both primary and secondary data. Sources of data is mainly survey
but also articles journals etc. Primary data has been collected through survey
from throughout the Dhaka city and secondary data has been collected from
various published sources and internet.
We
have also used SURVQUAL model for this paper. As a way of trying to measure
service quality, researchers have developed a methodology known as SERVQUAL – a
perceived service quality questionnaire survey methodology. SERVQUAL examines
five dimensions of service quality.
Figure
5 - The five SERVQUAL dimensions of service
|
Dimensions
|
Description
|
|
Reliability
|
Performing
the promised service dependably and accurately.
|
|
Responsiveness
|
Helping
customers and providing a prompt service.
|
|
Assurance
|
Inspiring
trust and confidence.
|
|
Empathy
|
Providing
a caring and individual service to customers.
|
|
Tangibles
|
The
physical facilities and equipment available, the
appearance of staff; how easy
it is to understand
Communication
materials.
|
Source:
Mori (2002) Public Service Reform: Measuring and understanding customer
satisfaction
For
each dimension of service quality above, SERVQUAL measures both the expectation
and perception of the service on a scale of 1 to 9, 22 questions in total. The
Gap Score for each dimension is calculated by subtracting the Expectation score
from the Perception score. A negative Gap score indicates that the actual
service (the Perceived score) was less than what was expected (the Expectation
score). The Gap score is a reliable indication of each of the five dimensions
of service quality. Using SERVQUAL, service providers can obtain an indication
of the level of quality of their service provision, and highlight areas
requiring improvement.
Outlined
below are the instructions for carrying out a SERVQUAL survey and a sample of
the questions used in the questionnaire. In this sample, a bank is surveyed
however; any service organization can be surveyed using this questionnaire. All
that needs to be done is to substitute the word "bank" with the
particular organization or industry being surveyed.
1. Select the bank whose service quality we want to assess. Using the
questionnaire (see Appendix A below), obtain the score for each of the 22
Expectation statements, and then obtain the score for each of the 22 Perception
statements.
2. Obtain an average Gap Score for each dimension of service quality
by assessing the Gap Scores for each of the statements that constitute the dimension
and dividing the sum by the number of statements making up the dimension.
3. Sum the averages calculated in step 2 above and divide by 5 to obtain
an average SERVQUAL score.
Data
is analyzed by with the help of SPSS (Anne Swindle, Punam Ohri-Vachaspati 1999,
2005). For this paper the researcher has used regression analysis (Marie .T
Ruel, Nicholas Minto, Lisa Smith, 2005), linear method (Anne Swindle, Punam
Ohri-Vachaspati 1999, 2005), descriptive analysis has been used.
b. Plan
of Data Analysis
To
facilitate the analysis of collected data, frequency distribution, cross
tabulation regression analysis and SERVQUAL have been performed. Frequency distribution has conducted to
count the number of responses associated with different values of the factors. Cross Tabulation has been used to
reflect the joint distribution of the factors and services with the basic
information of the customers. Regression analysis has been conducted to
identify the important factors. Finally SERVQUAL analysis has been performed to
measure the level of customer satisfaction.
Result and Findings
Analysis:
Consumer
perception:
Table-
5.1.1: Occupation* Currently using bank account cross tabulation
|
Occupation
|
Currently using bank account
|
Total
|
|
|
Savings account
|
Current account
|
||
|
Student
Service
Business
|
32
8
10
|
0
0
10
|
32
4
20
|
|
Total
|
56
|
5
|
56
|
From
the above table it is clear that students and service holder prefer to have a
savings account, whereas most of the business person has a current account.
Chart-
5.1.1: Education level

Most
of the respondents of BANK (46%) have completed graduation; among the others are
respondents having completed undergraduate/bachelor (25%), HSC (17.9%) and SSC
(10.7%).
|
Using
bank account
|
Customer
type
|
Total
|
|
|
General/Personal
|
Corporate/Business
|
||
|
Savings
account
Current
account
|
38
2
|
8
8
|
46
10
|
|
Total
|
40
|
16
|
56
|
Table-
5.1.2: Customer type* Currently using
bank account cross tabulation
This
table clearly indicates that, savings account is mainly popular among the
general people compared to the business people.
Table-
1.2 (Appendix) shows that most of the customer holds only one bank account
(53.6%), followed by respondents who have two accounts (28.5%) and so on. It is
surprising that 3.6% of the respondents have five or more number of accounts.
Chart-
5.1.2: Whether bank charges are fare

Among
the respondents 64.3% have agreed that Bank charges fare amounts for the
services offered by it, whereas 21.4% of the respondents are neutral to this
statement and 14.3% respondents have disagreed the statement.
Table-
5.1.3: Considerations in opening a bank account
|
Factors
|
Most
recalled
|
|||
|
1st
|
2nd
|
3rd
|
4th
|
|
|
Customer
service
Environment
Reputation
Personalized
service
Easy
of screen use
Quick
response
Convenience
Employee
behavior & bank environment
Wide
branch network
ATM
network
Continuous
service
|
78.6
14.2
0.0
0.0
0.0
3.6
0.0
0.0
0.0
3.6
0.0
|
0.0
72.0
12.0
4.0
4.0
4.0
0.0
0.0
4.0
0.0
0.0
|
0.0
0.0
48.0
8.0
0.0
32.0
4.0
0.0
0.0
8.0
0.0
|
0.0
0.0
0.0
18.2
0.0
36.4
36.4
0.0
9.0
0.0
0.0
|
The
table shows that the primary considerations while opening a bank account is
customer service (78.6%) followed by
environment (14.2%), quick response (3.6%) and ATM network (3.6%). In
their second recall environment was positioned at the top with 72%, followed by
reputation (12%) and the others and in their third recall reputation is the key
factor (48%) followed by quick response (32%) and so on.
Chart-
5.1.3: Taking bank services

ATM
services (89.2%) have been found as the mostly taken services among all the
services taken by the customers.
Table-
5.1.4: Wanted future facilities
|
|
Most
expected
|
||
|
1st
|
2nd
|
3rd
|
|
|
Internet
banking
E-mail
banking
Banking
system by personal representatives anywhere
Mobile
(place) banking
Street
banking system
Phone
banking
|
60.7
3.6
0.0
32.1
0.0
3.6
|
5.6
77.8
5.6
5.6
5.6
0.0
|
0.0
0.0
5.9
64.7
0.0
29.4
|
In
their first recall the customers mainly expressed that they expect to have
internet banking (60.7%) followed by mobile (place) banking (32.1%), e-mail
banking (3.6%) and phone banking (3.6%) as future facilities to be delivered by
the bank. In the second recall e-mail banking (77.8%) was placed first followed
by internet banking, mobile banking, etc. with 5.6% each and in the third
recall mobile banking stands at the top with 64.7%, followed by phone banking
(29.4%)
Table-
5.1.5: Known products and services
|
Factors
|
Most recalled
|
|||
|
|
1st
|
2nd
|
3rd
|
4th
|
|
Mobile
banking
Deposit
scheme
Vehicle
loan
SME
banking
Savings
account
Debit
card
ATM
services
SMS
banking
Personal
loan
Foreign
currency
|
82.2
10.7
0.0
0.0
7.1
0.0
0.0
0.0
0.0
0.0
|
0.0
51.9
3.7
22.2
18.5
0.0
3.7
0.0
0.0
0.0
|
0.0
0.0
18.5
25.9
22.2
3.7
25.9
0.0
3.7
0.0
|
0.0
0.0
0.0
18.5
25.9
14.8
11.1
3.7
22.2
3.7
|
Among
the respondents most of them knows about mobile banking (82.2%), followed by
deposit scheme (10.7%) and savings account (7.1%). Deposit scheme (51.9%) is
mainly known to them, followed by ATM services (25.9%), savings account (22.2%)
and others in the second recall, and in case of third recall savings account
(25.9%) stands at the top followed by personal loan (22.2%), SME banking
(18.5%) and others.
Table-
5.1.6: Customer service responsiveness
|
Factors
|
Most
recalled
|
|||
|
1st
|
2nd
|
3rd
|
4th
|
|
|
Call
answering time
Flawless/Correct
operations
Speed
of conducting operations
Knowledge
about products and services
Understanding
and replying queries correctly
Communication
skills/positive approach
|
71.4
10.7
10.7
0.0
3.6
3.6
|
40.0
48.0
0.0
8.0
0.0
4.0
|
0.0
0.0
37.5
25.0
33.3
4.2
|
0.0
0.0
0.0
30.0
25.0
45.0
|
The
table shows that in case of case of customer service responsiveness, the
respondents prefer call answering time (71.4%) mostly and flawless/correct
operations (10.7%), speed of conducting operations (10.7%) etc. follows it
respectively. In the second recall flawless/correct operations (48.0%) stands
at the top and in the third recall speed of conducting operations is found to
be the most important factors.
Most important factors:
Regression analysis:
To measure the satisfaction of the
bank account holders, the perception of the customers (performance of the case
study banks) on SERVQUAL dimensions have been measured. The dimensions have
been measured through a number of questions for each dimension.
In conducting the multiple
regression analysis, the mean value of the responses of the questions under
each dimension is considered as the score of that dimension. After calculating
the mean scores of the five dimensions (for each respondent) have been
regressed on the satisfaction scores (dependent variables) of corresponding
respondents.
|
Table- 5.1.7: Model summary
|
||||
|
Model
|
R
|
R Square
|
Adjusted R Square
|
Std. Error of the Estimate
|
|
1
|
.674a
|
.455
|
.331
|
.92723
|
|
a. Predictors: (Constant), Average scores of tangibles, Average
scores of responsiveness, Average scores of assurance, Average score of
reliability, Average scores of Empathy
|
||||
R2
indicates the strengths of
association among the independent and dependent variables. The higher the value
of R2 , the higher the strength of association among the dependent
and independent variables. R2 shows how much the variation in the dependent
variables can be explained by the variation in the independent variables. The
value of R2 in this case is .455 which implies that 45% variation in
dependent variables is due to the variation in the independent variables.
To
justify whether the R2 in the case at hand is significant or not, we
will have to analyze the value of F statistics. The calculated value of F
statistics is 3.667(Appendix) which is significant at 0.015 (at the level of
significance of 0.05). As the significance value is smaller than .05, the model
in the case at hand is significant.
|
Table-
5.1.8: Coefficients
|
||||||
|
Model
|
Unstandardized Coefficients
|
Standardized Coefficients
|
t
|
Sig.
|
||
|
B
|
Std. Error
|
Beta
|
||||
|
1
|
(Constant)
|
.449
|
.853
|
|
.527
|
.604
|
|
Average score of reliability
|
.173
|
.111
|
.316
|
1.562
|
.133
|
|
|
Average scores of responsiveness
|
-.074
|
.099
|
-.126
|
-.748
|
.462
|
|
|
Average scores of assurance
|
-.046
|
.102
|
-.078
|
-.453
|
.655
|
|
|
Average scores of Empathy
|
.272
|
.127
|
.440
|
2.143
|
.043
|
|
|
Average scores of tangibles
|
.019
|
.107
|
.038
|
.175
|
.863
|
|
|
|
|
|
|
|
||
From the Coefficients Table, we can
see the standardized coefficient beta calculated for each of the predictor
dimensions (SERVQUAL dimensions) showing the percentage of the variation in the
dependent variable (customer satisfaction) explained by each of the independent
variables. The table reveals that the Empathy dimension has the standardized
beta coefficients of 0.440 or 44% which is greater than that of the other
dimensions. The beta coefficient of Empathy (0.440) is significant at 0.043
which is lower than 0.05 indicating the rejection of null hypothesis “Empathy
has no impact on customer satisfaction”.
Thus the empathy dimension is found to be significant determinant of
satisfaction while the other dimensions are not found to be significant
predictor of customer satisfaction of Bank.
|
Dimension
|
Statement
|
Expectation
score
|
Perception
score
|
Gap
score
|
Average
for dimension
|
|
Reliability
|
1
|
8.36
|
5.93
|
-2.43
|
-2.55
|
|
2
|
7.86
|
5.64
|
-2.22
|
||
|
3
|
7.61
|
5.50
|
-2.11
|
||
|
4
|
7.86
|
4.43
|
-3.43
|
||
|
Responsiveness
|
1
|
7.86
|
5.96
|
-1.90
|
-1.64
|
|
2
|
7.89
|
6.07
|
-1.82
|
||
|
3
|
7.04
|
5.82
|
-1.22
|
||
|
Assurance
|
1
|
8.11
|
5.64
|
-2.47
|
-2.01
|
|
2
|
7.86
|
6.39
|
-1.47
|
||
|
3
|
7.89
|
5.54
|
-2.35
|
||
|
4
|
8.04
|
6.29
|
-1.75
|
||
|
Empathy
|
1
|
7.68
|
3.89
|
-3.79
|
-3.80
|
|
2
|
7.43
|
3.04
|
-4.39
|
||
|
3
|
7.82
|
4.61
|
-3.21
|
||
|
Tangibles
|
1
|
8.43
|
5.96
|
-2.47
|
-2.59
|
|
2
|
8.07
|
5.64
|
-2.43
|
||
|
3
|
8.21
|
5.39
|
-2.82
|
||
|
4
|
8.00
|
5.36
|
-2.64
|
||
|
Average
SERVQUAL score
|
-2.52
|
||||
Table- 5.1.9: SERVQUAL
SERVQUAL
scores having negative value means that the customer satisfaction is negative,
contrary positive SERVQUAL implies the customer satisfaction is positive. The
average SERVQUAL score for Bank is -2.52 which means that the customers are not
satisfied with the bank.
Recommendation
and Conclusion
Customer dissatisfaction
occurs when the customer does not get what she expected. When a product does
not behave as promised or a service is not delivered as expected, the customer
becomes - a dissatisfied customer. Find out where customer satisfaction stands.
Ask customers what they like and dislike about the company. The customer and
the business
may have different ideas of what needs to be fixed.
The above graph sows that
customer service plays a vital role in customer’s loyalty. And if the customers
are not satisfied with the overall service off the organization.,
The most effective way to
improve customer satisfaction for any organization are the followings –
Processes
Customer dissatisfaction arises primarily
from breakdowns within a company. Often, bottlenecks in the process cause the
customer not to get the service he expected. A bottleneck occurs when outputs
are significantly slower than inputs. For example, if it takes two minutes to
assemble the bottom of a jewelry box, but six minutes to assemble the top of
the box, then the bottleneck occurs at the assembly of the top of the jewelry
box. As a result, over the course of 30 minutes, 15 box bottoms go in, but only
five box tops go out, which holds up box production. To begin solving process
problems, map the process. A flowchart is a visual representation of the
process. This gives management and other stakeholders the opportunity to see
how one part of the process affects another part. The team can determine which
actions to start performing or stop performing.
Technology
Information Technology (IT) is the
backbone of a company's infrastructure. Check to ensure the information systems
can handle the volume and type of business. Questions that management should
ask of itself: Are the computer systems outdated?
Are the systems maintained properly? Are customer records accurate or
duplicated? Should systems be customized? Hire a consultant to review the
company's technology needs vs. the technology the company currently uses. For
customer records, create an internal, cross-functional project team to
standardize customer records. Create procedures/best practices for entering
customer records, and then train the staff on the new procedure. Periodically,
audit customer records to keep them accurate and standardized.
People
Having the right people performing the job is very important. Are your customer service personnel
impatient? Is your management board? Assess the job skills and interests of the
staff. If they are not engaged, customer satisfaction can suffer. Additional
job responsibilities can increase employee satisfaction. Use the employee to
help solve customer satisfaction problems the customer is experiencing, thereby
satisfying the customer and giving the employee a new skill set by working on
the project.
Here are our suggestions to improve the satisfaction rate -
1.
Stay in contact with customers on a regular basis. Offer them a free e-zine
subscription. Ask customers if they want to be updated by e-mail when you make
changes to your Web site. After every sale, follow-up with the customer to see
if they are satisfied with their purchase.
2.
Create a customer focus group. Invite ten to twenty of your most loyal
customers to meet regularly. They will give you ideas and input on how to
improve your customer service. You could pay them, take them out to dinner or
give them free products.
3. Make it easy for your customers to navigate
on your web site. Have a "FAQ" page on your Web site to explain
anything that might confuse your customers. Ask them to fill out an electronic
survey to find out how make your web site more customer friendly.
4.
Resolve your customers’ complaints quickly and successfully. Answer all e-mail
and phone calls within an hour. If possible, you the owner of the business,
personally take care of the problem. This will show your customers you really
care about them.
5. Make it easy for your customers to contact
you. Offer as many contact methods as possible. Allow customers to contact you
by e-mail. Hyperlink your e-mail address so customers won't have to type it.
Offer toll free numbers for phone and fax contacts.
6.
Make sure employees know and use your customer service policy. Give your employees
bonuses or incentives to practice excellent customer service. Tell employees to
be flexible with each individual customer, each one has different concerns,
needs and wants.
7.
Give your customers more than they expect. Send thank you gifts to lifetime
customers. E-mail them online greeting cards on holidays or birthdays. Award bonuses
to your customers who make a big purchase.
8. Always be polite to your customers. Use the
words your welcome, please, and thank you. Be polite to your customers even if they
are being irate with you. Always apologize to your customers should you make a
mistake. Admit your mistakes quickly and make it up to them in a big way.
9.
Reward customers a point for every one dollar they spend. Let's say customers
can get a free computer for 300 points. That means customers will spend $300
dollars on your products and services to get enough points to get the free
computer.
10.
Build strong relationships with your customers. Invite them to company
meetings, luncheons, workshops or seminars. Create special events for your
customers like parties, barbecue's, dances etc. This will make them feel
important when you include them in regular business operations and special
events.
References
Ahmad Jamal, Kamal Naser(2002), “Customer satisfaction and retail
banking: an assessment of some of the key antecedents of customer satisfaction
in retail banking”, International Journal of Bank Marketing 20/4,146-160
AF- www.emeraldinsight.com/journals.htm?articleid=1610219&show=pdf
[accessed
10th November, 2010]
Anderson,
Eugene W., Claes Fornell, and Donald R. Lehmann (1994), “Customer Satisfaction,
Market Share, and Profitability: Findings from Sweden,” Journal of Marketing,
58 (3), 53-66.
AF-
www.theacsi.org/index.php?option=com_content&task=view&id=50&Itemid=122
[accessed
10th November, 2010]
Anderson,
Eugene W., Claes Fornell, and Roland T. Rust (1997), “Customer Satisfaction,
Productivity, and Profitability: Differences Between Goods and Services,”
Marketing Science, 16 (2), 129-145.
AF-
http://bear.warrington.ufl.edu [accessed 10th
November,
2010]
Anderson,
Eugene W. and Mary W. Sullivan (1993), “The Antecedents and Consequences of
Customer Satisfaction for Firms,” Marketing Science, 16 (2), 129-45
AF-
www.jstor.org/stable/184036
[accessed
10th November, 2010]
Anderson,
Eugene W. and Vikas Mittal (2000), “Strengthening the Satisfaction-Profit Chain,” Journal of Service Research, 3
(2), 107-120.
AF-
www.uni-weimar.de/medien/.../lehre/.../andersonmittal_2000_jsr.pdf
[accessed
10th November, 2010]
Beerli, A., Martin, D. Josefa, and Quintana, A. (2004), “A model
of customer loyalty in the retail banking market“, European Journal of
Marketing, Vol. 38 No. 1/2,pp. 253-275 Available from: www.emeraldinsight.com/journals.htm?articleid=853921
[accessed 15th November, 2010]
Bena.
I, 2010, EVALUATING CUSTOMER SATISFACTION IN BANKING SERVICES, Management
& Marketing , Vol. 5, No. 2, pp. 143-150;
AF
- www.managementmarketing.ro/pdf/articole/188.pdf,
[accessed 15th November, 2010]
Cohen.
D, Gan. C, Yong. H. H. A and Choong. E; CUSTOMER SATISFACTION: A STUDY OF BANK CUSTOMER RETENTION IN NEW
ZEALAND;
AF
- www.lincoln.ac.nz/Documents/2308_DP109dc_s6473.pdf
[accessed 15th
November, 2010]
DeWulf,
Kristof, Gaby Odekerken-Schröder, and Dawn Iacobucci (2001), “Investments in
Consumer Relationships: A Cross-Country and Cross-Industry Exploration,”
Journal of Marketing, 65 (4), 33-50.
AF- www.atypon-link.com/AMA/doi/abs/10.1509/jmkg.65.4.33.18386
[accessed
10th November, 2010]
Drucker,
Peter F. (1954), The Practice of Management, New York: Harper & Row
AF-
www.questia.com/PM.qst?a=o&d=55843924
[accessed
10th November, 2010]
No comments:
Post a Comment