About Square Textile Ltd.:

Square
Textiles Limited has started its journey by establishing the first unit in
1997. One year later the second unit was established. Square Textile is a
subsidiary company of Square Group .The Company was incorporated as a public
limited company in the year of 1994. The operation was started in 1997.It was
enlisted in Dhaka Stock Exchange & Chittagong Stock Exchange in 2002.
Within a very short time of span the company achieved some significance
success. Square Textile receives Oeko-Tex standard 100 and ISO-9002
certificates in the year 2000. Authorized capital of the company is tk. 1000
million. It’s paid- up capital is tk. 251.90 million. 1,223 employees are
working in this organization. The business lines of Square Textiles Limited are
manufacturing and marketing of yarn. The factory is located in Saradaganj,
Kashimpur, Gazipur, Bangladesh. Its office is located at Uttara in Dhaka. Its
main objective is to strive hard to optimize profit through conduction of
transparent business operations within the legal and social framework with
malice to none and justice for all.
Rationality of Study:
This
Assignment is on different financial analysis of Square Textiles Limited. here,
different financial analysis is conducted to find out the actual position of
the company in the current market situation. In this Assignment, ratio analysis
cost of money and stock valuation is conducted to find the right decision.
Financial &
Operational Highlights:
Liquidity Ratios:
Liquidity ratio measures the firm’s ability to meet its
obligations, ability to pay its obligation and when they become due. These
ratios establish relation between cash and other current asset and current
liabilities. Commonly used ratios are
·
Current Ratio
·
Quick Ratio
1.
Current Ratio:
Current Ratio shows the
proportion of current assets of a business in relation to its current liability
Current Ratio = Current Asset /Current
Liability
Standard
=2:1


Analysis: The
current ratio measures the company’s ability to pay off its current liability.
Here we can see that current ratio was highest in 2012 with compare in
preceding years. We know standard of current ratio is 2:1. It means a current
ratio 2 means that current asset asr sufficient to cover for twice the amount
of a company’s short term liabilities and then it is considered to have good
short term financial strength. But I 2012 Current Ratio is above 2, so it denotes
that CR Liquidity company has idle money, so it is not good
sign for the Square textile Ltd. So in a concluding note I would like to say
company should utilize their idle money in a profitable manner.
2.
Acid Test Ratio :
The Acid test or quick ratio or liquid
ratio measures the ability of a company to use its near cash or quick assts to
extinguish or retire its current liabilities immediately.
Acid Test = Current Asset – Inventory
/Current Liability (times)
·
Standard = 1:1
· QR Liquidity


Analysis:
Quick ratio is the most conservative ratio
in calculating liquidity position. A company with a quick ratio of less than 1
can not currently pay back its current liabilities ; it’s the bad sign of
investors .Here we can see that acid-test was not stable in 2008 & 2010 ,
but it was increased dramatically in 2012. The company’s current liquidity
position in 2011 is satisfactory. But too much liquidity is not good. In 2012
it is too liquidity. Which can be a good sign and as well as bad sign.
v Activity /Efficiency / Asset Ratio
Activity ratios are used to evaluate the competence, which
the company manages and utilizes on its asset. This ratio also calls the
turnover ratios because they indicate the speed with which the assets are
transformed or turnover into sales. A proper balance between assets and sales generally
reflects on that the assets.
The Activity ratio we can satisfy on the three ratios,
those are:
- Accounts Receivable Turnover.
- Inventory Turnover
- Fixed Assets Turnover
- Accounts Payable Turnover
- Total Asset Turnover
- Average Collection Period
·
Accounts Receivable
Turnover:
This ratio helps to find out average
collection period of accounts receivables. The lower the collection periods the
higher the management efficiency measure collect the account receivables.
Receivable Turnover = Net Credit
Sales / Accounts Receivable
ART Efficiency

Analysis:
Accounts receivables turnover is measure
the number of times per year that the average amount of receivables is
collected and transfers the cash amount. If the organization account receivable
turnover increase then the average collection period decrease and vice-versa.
Here we see that in 2012 is 2.67 times account receivable turnover Highest and
Average collection period less. In 2012 a high value of accounts receivable
turnover is favorable because it indicates high efficiency and improvement in
the process of cash collection on credit sales
 Average Collection Period:
The approximate amount of time that it
takes for business to receive payments owed, in terms of receivable , from its
customer and clients.
ACP efficiency

Analysis:
·
Inventory Turnover
ratio:
A ratio showing how many times a company’s
inventory is sold and replaced over a period.
Inventory Turnover = COGS / Average
Inventory
IT
efficiency

Analysis:
Inventory turnover ratio measures how fast
the inventory become cash or accounts receivable. If the turnover number is
more than the company’s position is good and vice versa. In 2008 it is
2.04 times and in 2009 is 3.55 times in 2010 it is 2.19 times in 2011 it is
3.38 in 2012 3.85. Here we see the turnover is increasing over the time. It
shows a positive impact on their management efficiency.
Inventory Processing period:
The approximate amount of time that it takes for a business to sell &
replace its inventory
IPP efficiency

Analysis:
Average payment period tell about how many
time a company takes to pay its accounts payable. If a company quickly pays the
accounts payable then it means they can’t use their capital properly on the
other hand if it take too much time to pay its accounts payable then it will
hamper their reputation toward its debtors. It wills create problem for further
loan. Here we have seen their average payment period is decreasing over the year.
In 2012 the period slightly decreases then the previous year. The overall
position is good.
·
Account Payable Turnover:
Is an accounting
liquidity metric that evaluates how fast a company pays off its creditors (suppliers)
Account
Payable Turnover: Credit Purchase/ Average Accounts Payable
APT
Efficiency
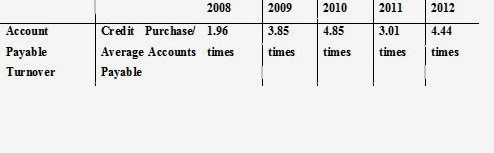
Low value of account payable turnover is
favorable and higher figure may indicate inefficiency. Square company’s payable
turnover increasing over the year it indicates too much inefficiency of the company.
- Average Payment Period:
Average Payment Period means the average
period taken by the company in making payments to its creditors.
Low value of account processing period is
favorable and higher figure may indicate inefficiency. Square company’s payable
turnover increasing over the year it indicates too much inefficiency of the
company.
APP Efficiency

Analysis:
Company’s
total asset turnover is good because it is increasing over the year.
v Profitability Ratio
Profitability ratio represents the organization’s ability
to translate sales dollars at different stages of measurement. The ratio
measures profitability after consideration of all revenues and expenses,
including interest taxes and non-operating items. This ratio specify the
capacity of the company to survive difficult circumstances, which might occur
from a number of basis, such as declining price, increasing coast and declining
sale.
The profitability ratio we can justify on the five ratios,
those are as follows
·
Gross
Profit Margin Ratio
·
Net
profit Margin Ratio
·
Return
on Investment/ Asset Ratio
·
Return
on Equity Ratio
1.
Gross Profit
Margin:


Analysis:
Gross margin ratio is used to analyze how efficiently a
company is using its materials, labor and manufacturing related fixed assets to
generate profits. A higher gross margin percentage is a favorable profit
indicator and vice-versa. This ratio helps organization to fix their product
price. If the ratio minimum percentage then indicates the product market price
lower or product production cost high. Here we see that gross margin ratio was
quite stable in 2010 & 2011 but it fall down 2% in 2012 which can give alarm for Square
Pharmaceuticals Ltd
2.
Net profit margin
Profit Margin= Net Income /Net Sales*100


Analysis:
Net income to sales ratio is very important in operating
performance measurement. This ratio is helpful in identifying the proportion of
sales unit that remains after the deduction of all expenses. This ratio indicates
the net amount of profit on each sales taka. The amount of net income includes
all types of non operating items that may occur in a particular period. The
ratio dropped in 2009, then increase in 2010. But it again fell in 2011.
As a result company has generated less profit than 2011
3.
Return On Asset:
Return on Asset = Net Income /Total Asset.
Asset
3.68% 3.14% 4.92%
5.20%


Analysis:
Return on total assets indicates how profitable a company
is relative to its total assets. It also indicates the management efficiency to
utilize total assets to make profit. In 2011 it has been slightly increased
compared to the previous year. So it can be said that company generates 3.68%,
3.14%, 4.92%, and 5.20% return on the assets that it employs in its operations
in this four year time period.
4.
Return On Equity:
Return on Equity = Net Income /Total
Equity


Analysis:
Return on equity is the measurement of shareholders wealth
maximization. It indicates how much shareholders earned from their investment.
The higher the ratio indicates higher the shareholders wealth maximization.
Return on equity is highest in 2009 return shows 16%. So it’s bad news for
Square Pharmaceuticals Ltd. that its present ROE is decreasing than previous
year.
v Market Measures Ratios
1.
Price Earnings
Ratio :
Price Earnings Ratio = Market Price /
Earnings Per Share0

Analysis:
Price earnings ratio is the most widely used indictors in
investment decision. It indicates how much an investor would be paying for
every taka earnings. Price earnings ratio was height in 2009 but it has
decreasing in 2010. So it means market price of BPL was fall in 2011. In 2012
P/E ratio go up .So company is now growing up & should aware also of their
P/E ratio.
Earnings Per Share
Earnings per Share = Net Income / Number
of Common Stock
Share 46.45 times 37.72
times 32.32times 19.66 times
Analysis:
Price earnings ratio is the most widely used indictors in
investment decision. It indicates how much an investor would be paying for
every taka earnings. Price earnings ratio was height in 2008 but it has
decreasing in 2009. So it means market price of BPL was fall in 2011. So
company should aware of their P/E ratio.
·
Solvency
/Debt Coverage Ratio
Debt ratios are calculated to judgment the long-term This
ratio indicate, mix of funds provided by owners and lenders, the manner in
which the assets are finance, the extent of earning that is magnified or
leveraged by use of debt and finally the extent of limited stakeholders control
over the company.
The Debt- coverage ratio we can satisfy on two ratios,
those are:
·
Debt
to total assets
·
Time interest earned
Debt Ratio: The ratio of total debt to
total assets. It measures the percentage of the firm’s assets financed by
borrowings.
Debt Ratio


Analysis:
Debt
ratio is widely used indictors in investment decision. It indicates how much an
investor has debt against assets. Debt ratio was height in 2008 but it has
decreasing in 2009. So it means market price of BPL was fall in 2011. So
company should aware of their Debt ratio.
Conclusion:
Financial statements of a company are
most important for finding their situation. As a partial requirement of Managerial
Finance this report the ratio analysis of financial statement” has been
prepared.
This report broadens our understanding in
internal control. Though this task we have gained real life experience on Managerial
Finance. By doing this report. We faced some difficulties like secrecy of
information, lack of budget, prior experience etc. So, these are some week ness
in this report. The main objective of this report was to understand and find
out the financial position of Square Textile Ltd.
Bibliography
01. Accounting principal (8th
edition)
02. By Weygandt, Kiso, Kimmel
03. Company
profile
- See more at: http://www.assignmentpoint.com/business/finance/ratio-analysis-of-financial-statement-of-orion-fusion-ltd.html#sthash.8TP6egGn.dpuf
·
Internet Source: Google, Encyclopedia,
Wikipedia.
·
Company website: www.hsbc.bd.org
No comments:
Post a Comment